


One of the joys of writing a book is interacting with readers. Many authors experience forehead-thumping “duh!” moments as they hear questions and realize that they left out an important detail or could have provided an example to clarify. Now that Value Stream Mapping has been released, great questions are starting to roll in—along with the need to clarify a few points.
This post addresses a question about Lead Time (LT) that has been asked by several readers who work in manufacturing. The question has taken several forms:
WARNING: If you have never mapped a manufacturing value stream, you may find this post a bit confusing and may be better off not reading it. :-)
As we mention in the Acknowledgements section of Value Stream Mapping, “Very few people know how many times and for how many years we considered writing this book and then decided against it. We felt that the value stream mapping ship had sailed.” We go on to explain that we wrote it to close the significant gap that existed about how best to apply value stream mapping in office, service, and knowledge work environments.
We also wanted help those in manufacturing learn how to get deeper results by using value stream mapping as a management practice versus viewing it solely a workflow design tool. (More about this in a webinar I’m giving on Wed April 23 hosted by Gemba Academy. Click here to register: www.gembaacademy.com/webinars/martin-vsm.)
Therefore, in the mapping “mechanics” chapters of Value Stream Mapping that address how to physically create current and future state value stream maps (chapters 3 & 4), we intentionally didn’t include manufacturing mapping icons, terminology, and metrics. Because that book had indeed been written (Mike Rother & John Shook’s Learning to See).
In hindsight, perhaps we should have included at least a few footnotes to highlight some of the major differences between office- and manufacturing-based mapping conventions. The treatment of lead time is one of those differences.
In any value stream there are multiple measures of lead time (also known as throughput time, turnaround time, and response time), including:
The customer experience lead time is the elapsed time from receiving a customer request to delivering on that request. The lead time for extended value streams can also include the lead time for processes before a customer request is received (supply chain, sales and marketing processes, etc.) and after delivery (warranty work, invoicing, etc.).
In manufacturing, the lead time between process blocks is typically calculated based on the days of demand of the observed WIP that has accumulated between process blocks: Lead Time = Observed WIP/Daily Customer Demand. This may or may not represent how long it takes the following process to consume the materials.
In office, service, and knowledge work environments, we define the lead time for each process in the value stream as the elapsed time from the moment work is made available to a person, work team, or department until it has been completed and made available to the next person, work team, or department in the value stream.
We use this approach for a number of reasons:
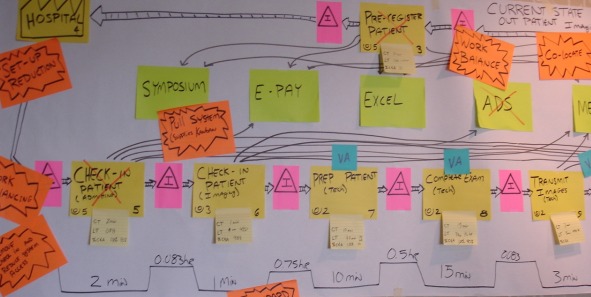
In office, service and knowledge work environments, we recommend that you follow a single “work item” as it passes through the value stream, whether it’s verbal information, electronic information, or a physical item (which may include people as in healthcare patients, restaurant customers, etc.).
(Keep in mind that work items in office and service settings typically transform as they pass through a value stream, just like a product does in manufacturing. For example, the work items in a software development value stream mapping activity I recently facilitated are: email request → request for quote → quotation → purchase order → work order → beta code → final code → invoice. Every value stream has its own version of work item transformation.)
To repeat, the process block lead time for a single work item is the elapsed time from the moment it’s received until it’s handed off to the next process in the value stream. It includes the process time (the time it takes to actually do the work, also referred to as touch time and cycle time), as well as any waiting/delays that may occur:
Example: LT = 2 hours for a work item that arrives in Work Area A at 1 pm and is passed to Work Area B at 3 pm is two hours. If the work takes 20 minutes to complete, the lead time is still two hours, but 20 minutes of the two-hour lead time is process time and the work sits idle for 1 hour and 40 minutes.
Note, too, that WIP can accumulate during any of the three stages bulleted above. We typically include WIP on our value stream maps to see where the largest queuing and constraints lie versus using those numbers to calculate the lead time. (However, in high volume office “production” areas with dedicated resources, the lead time will approximate WIP/daily demand).
As you can see on the sample value stream maps in our book’s Appendices and on the VSM segment shown later in the post, the WIP for a particular process is shown to the left of the process block and includes WIP from any of the three stages listed above:
 calculation")
Sadly, there is no industry-wide standard for value stream metrics and timeline conventions. Some people break process time into value-adding and non-value-adding time and show the sum for each category. Some people separate pur waiting time from the lead time rather than viewing it as a single throughput time metrics. Some people use the traditional square-wave timeline shape (commonly referred to as a “sawtooth” timeline), while others use a straight line. And so on.
When we first learned value stream mapping 15 years ago, we used the square-wave type timeline and placed the lead time on the “peak” of the timeline to the left of the process block it referred to. And we placed process time in the “trough” of the timeline directly below the process block it referred to.
But over the years, we found that teams consistently got tripped up with which metric went where. And the metrics placement didn’t make intuitive sense to many teams when they had to reverse the placement in their minds in order to calculate Activity Ratio. [Activity Ratio (AR) is a summary metric we use to reflect the degree of flow, which we’ve described in Value Stream Mapping (p. 90), as well as our two earlier books, The Kaizen Event Planner and Metrics-Based Process Mapping: AR = (Sum of timeline process times/Sum of timeline lead times) x 100.] In the formula, process time is on top. On a sawtooth timeline, it’s on the bottom.
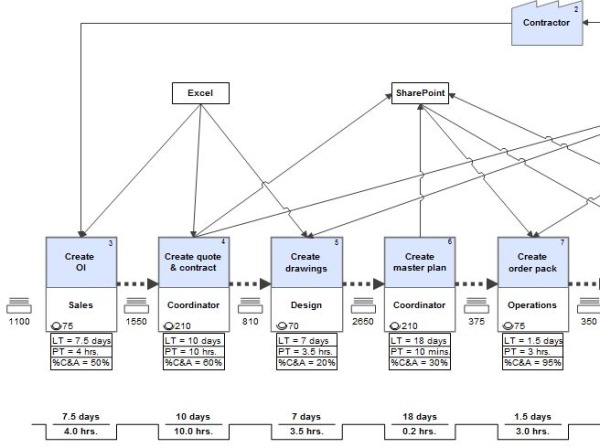
For these reasons, we eventually moved to a single line timeline, with process time on the top and lead time on the bottom. In the below example, process time is above the line and expressed in minutes, and the lead time is below the line and expressed in hours:
Because our preferred software for creating electronic versions of maps (which aid in distribution and storage), iGrafx® FlowCharter, doesn’t yet have a straight line option for the timeline, we created a workaround that enables us to place both metrics directly below the process block, which approximates a manually drawn straight line.
However, due to iGrafx hard-coded conventions, the lead time remains on top. I share this because it answers the question we’ve gotten about why the timelines on the sample value stream maps we included in the Value Stream Mapping appendices look as they do:
So that’s the story. I hope this clarifies why and how we treat lead time the way that we do. I invite your comments and will continue to periodically post responses to the questions we’re getting, so please keep them coming.
I wish you the best as you begin experimenting with or refine your use of value stream mapping to transform your value streams.
As a reminder, I offer free monthly webinars where I cover topics such as this. You can learn about them by subscribing: tkmg.wpengine.com/subscribe.
You can also listen to the recordings for past webinars on our website, YouTube, Vimeo, and SlideShare (which also includes the slides). I’ve given six webinars on value stream mapping in the past six months, which you may find helpful.
Click here to register for my next value stream mapping webinar, hosted by Gemba Academy on Wednesday April 23 at 9 am Pacific Time.
And for more information on the book, visit tkmg.wpengine.com/value-stream-mapping. We give in-house value stream mapping workshops as well.
Steve – GREAT way to remember where to place the LT and PT metrics. I still use the square wave timeline at clients who are used to it, so I’m “borrow” that reminder from you, if you don’t mind. :-) Thank you for commenting.
Hi Karen – enjoyed the book and good to see the further “demand pull” refinement.
Thank you, Danie. Glad you enjoyed it! If you’re the reviewing type, Amazon reviews are very helpful for prospective buyers and we’d appreciate a review very much If not, please no worries. Reviewing isn’t for everyone. Have a great day!
Recently, I gathered four business heads, without the subject matter expert entourage, and we successfully used your process!
We effectively used the charter, then a high level vsm, to agree of what improvements they wanted to achieve. The heads saw that some silos would have to be broken to allow the subject matter experts the latitude to later suggest the ‘how’ of what was wanted. There is no doubt in my mind that if the subject matter experts would have been in the room (and usually I would have felt I needed them to be there), the business heads would not have agreed to break their fiefdoms because human nature would have caused them to ‘save face’ rather than achieve the greater good.
So, thanks for the insights that were in the book. They worked.
This is a great story, Kelly. It’s true that, in the spirit of workforce engagement, many people try to include people on VSM teams who aren’t strategic thinkers, which can pose problems for making large decisions. I hope our book continues to help people experiment with VSM as a strategic (vs. tactical) tool so it can yield the greatest results. I’ll bet your leadership team is also more aligned than ever, a critical success factor.
Thank you so much for sharing this. All the best for continued success!
Hi !
Thanks for the Webminar and truly enjoyed it.
Have a Question… Have been using TAKT to calculate operational Inventory lead time. Have been challenges numerous times on why this is so and why not cycle time as in basic time analysis. Is this to do with single process step vs end-to-end? help me explain this better.
Help me explain this better.
Hello Raj – I’m glad you enjoyed the webinar. I’m not sure I fully understand your question but I do think you may be confused about the purpose for takt time and how to calculate it. Rather than write a full description here, I’ll refer you to https://theleanthinker.com/2010/04/28/takt-time-cycle-time/ to learn more. In a nutshell, takt time reflects the frequency of output (pace) needed to meet customer demand. The two variables are customer demand and available work time. Lead time doesn’t enter into the picture, nor does process time. Takt time = available work time/customer demand.
If you’re not operating to takt, customer lead time may grow due to the accumulation of WIP (work in process). You can use process time and takt time to determine the number of operators you need to meet customer demand (# operators needed = takt time/process time). But those are the only two direct relationships between lead time and process time and takt time. I hope that helps.
Karen,
I think the question actually has to do with using Little’s Law to calculate NVA time, rather than using process/delay time. In manufacturing we convert a count of parts to Days of inventory, by dividing by takt time (100 items in queue / 100 items/day demand = 1 day of inventory).
I’ve been thinking about it since I read your book, it doesn’t so much make sense to use Little’s Law for a transactional VSM, especially if People are flowing through the system. The assumption in manufacturing is a work center will produce only what’s demanded by the customer. But a transactional ‘work center’ is not going to just stop for the day when they’ve finished the daily demand, they’re going to empty their queue (if it’s people).
So the conclusion I came to, for our Transactional maps, is to just use the Delay Time to calculate NVA for a process, and if it’s applicable, use Little’s Law to convert the queue level to days of NVA time.
Thank you for your comment, Jon. I don’t agree with using just the delay time to calculate NVA for a process. After all, a large chunk of process time is also often NVA in transactional processes (correction, clarification, reviews/audits/approvals, etc.). In fact, I don’t calculate NVA time separately because I’m not looking to merely reduce waiting time. I’m also looking to reduce handoffs, eliminate unnecessary tasks, optimize VA work, etc.
If you’re saying that takt time is irrelevant in a transactional environment, sometimes it is and sometimes it’s not. It depends on how “production-like” the process is, how erratic demand is, and how it’s staffed.
Thanks Karen.
My apologies for over simplyfing… Let me clarify my question
In your explanation in the article above, the lead time of material between process steps = WIP / daily demand… and may or may not represent how long it takes the following process to consume the materials.
I have always had trouble explaning why this is so especially since the inventory goes through as fast as the next process.
My explanation has been 2 fold… i.e. single step vs end-to-end process the inventory gets stuck at the end and only gets delivered based on demand. And the process step need not be the only reason inventory sits in a place… information or scheduling are other possible factors.
Is this correct ?
Yes. To be honest, I’ve never fully understood why Learning to See suggested that we calculate process block LT this way. But that’s how most manufacturers do it. Remember that this isn’t necessarily the LT you quote a customer, especially in a build-to-inventory environment. It’s just the way most people calculate LT for manufacturing production value streams.
Karen this a great wide and deep point of view about VSM, now you already gave me other way to do VSM’s for the future whe I develope this tool. I’m completely agree with your vision regards VSM, thanks
Thank you, Luis. I’m glad this post was helpful. All the best for successful value stream transformation!
Karen,
Great webinar this week on VSM. You made a comment during your presentation regarding cutting headcount. It sounds like you have a pretty hard and fast rule about using these tools and eliminating headcount. How do you communicate this to the front-line employees when impelementing changes to processes? So many organizations have made comments to employees that “jobs will not be eliminated” from company initatives only to see associates downsized later. What approaches have you taken to help gain the support and buy in from the front line to help gain their engagement?
Hi Bill – Thank you for your kind words. I’m glad you enjoyed the webinar! Great question. So, I’m finally at a place in my consulting career where I interview clients and select them as much as they select me. I have extremely candid discussions with senior leaders about what Lean is and what it is not and talk very specifically about the downsizing topic. If they need to downsize due to a legitimate business needs such as loss of a key customer, general market share loss, I ask them to lay off first and then engage my firm. Or, if there are performance issues with individuals where letting go is likely, I ask them to accelerate the action so the letting go process isn’t misconstrued to be linked to improvement work.
I once had a client commit to the “no layoffs” rule and then they laid off two months after I began working with them. I discontinued working with them shortly after because I could see that, for all of the head-nodding their leadership team did, breaking their commitment was an leading indicator of difficulties ahead. And being in the change business is tough enough without knowingly going into or continuing in a no-win situation. Again, I’m now in a position that I can be firm on this rule, whereas I was more “flexible” in my early consulting days. I now know what it takes for an organization to succeed and I know I know. :-)
There’s a formal process that’s deeply laced in psychology that I use for every engagement and improvement activity. For example, I require executive sponsors on all projects and they have to assure staff that the work ahead isn’t an exercise to eliminate people. I also draw out concerns/fear whenever I sense them and talk about them openly. Trust can be destroyed in an instant and take years to rebuild, so employees typically have a good reason for fear based on their experience.
Finally, if I’m 100% certain that the leadership team is fully committed to no layoffs (which I’m now pretty darn good at assessing), I’ll ask the frontlines to please trust me and come with me on a wonderful journey. Their duties may shift, but they won’t lose a paycheck. And I also guarantee them, that they’ll like their work better in the “new world” than they currently do. Top date, I’ve never been proven wrong on this one.
I hope this helps. There’s more I could include, but you’ve got me thinking that this should be a separate blog post, so I’ll save the rest for another day. :-)
Thank you for your question – good one!
Hi Karen,
I am new to VSM. I work in a warehouse environment where typical processes are receipt, putaway, pick, pack, ship. I still do not understand takt time. How do I get the daily customer demand? Example: I have 67 customers. Working hrs in a day is 8 hours which means (8x60x60) 28800 secs. For the available work time, must it always be converted to seconds? I was told to calculate the leadtime or wait time= (WIP x takt time) divide by 28800 secs. Is this correct? I am confused since in your post to Raj that leadtime has nothing to do with takt time.
Hello Samantha – This is tough to address in a brief comment – you may want to engage in our coaching/training services to help you deepen your skills. Takt time is a simple equation: Time divided by customer demand. It can be expressed in any time-based unit of measure (UOM): seconds, minutes, hours, weeks, months or years. You need to select whichever UOM makes the most sense for your volume (customer demand). Is your warehouse working only one 8-shift per day? If so, then the available time is hours or minutes. I doubt that seconds will be relevant to a warehouse process, but it could be. Completely disagree with what you were told re: LT calculation. After all, you’re most likely not currently working to takt, so takt wouldn’t be a given, right? LT is the elapsed time (think ticking clock) it takes to fulfill a request. Does this help?
Hi Karen,
Thank you for your fast response. Yes, takt not calculated and hence not working to takt.
Referencing the square wave timeline, according to your definition, leadtime will be the sum of (time at the peak and at the trough), am I correct?
Is there specific formula to calculate time at the peak and time at the trough? For time at the trough which is referring to the process time, I did not use any formula. I enter the actual time it took to do the process step, is it fine?
However, I am stuck with the time at the peak which I understand refers to waiting time of the WIP, am I correct? Do I need to use a formula to calculate this time? I was given this formula – (WIP x takt time) divide by available hours.
Looking forward to your advice. Thanks.
Hi Samantha – This is difficult to do via comments on a blog post. Do you have my book with Mike Osterling, Value Stream Mapping (www.bitly.com/VSMbk)? I believe that would provide a full description that can address your questions. There aren’t “formulas” for calculating elapsed (lead) and touch (process) times. They are what they are. As my blog post suggests, converting WIP to lead time is appropriate in manufacturing and less so in office & service settings. I hope that helps.
Hello, Karen,
For several months already I am your thorough reader and webinar watcher.
Last week my team an I started our first VSM. We are doing the office VSM.
I am using iGrafx 2013 and am a bit confused. There is simply no such thing as Lead Time – nor in the block (https://screencast.com/t/yd4HuteA), nor on the timeline (https://screencast.com/t/zbsOTgDV) or in the aggregated data box (https://screencast.com/t/vwHKfGMhYU). Can you comment on that? How do I enter the Lead Time here?
The second question is regarding %C&A. Even though I managed to find an option to add it (it is called Rolled Throughput Yield in iGrafx, right?) to the aggregated box (https://screencast.com/t/hmJvKTjH) I don’t see where I can specify the %C&A percentage for each block – there is simply no option for that and I can’t find where to add that option: https://screencast.com/t/Ky2JdiaDFYyK unless I just create a custom parameter, which, I think, would be wrong (because aggregated table has this parameter already).
I will greatly appreciate your help on these two..
Hello Bogdan. Thank you for being a reader/viewer and for your question. Since lead time is very much a part of iGrafx FlowCharter, so I’m a little unclear on the problem. %C&A is the opposite from Defect Rate in FlowCharter so we’ve created a work around by using Process Cycle Efficiency. I can’t include pictures in a reply to my blog post but am happy to send you screen captures if you email me through the contact page on my website.
Hello Karen. I am a student and i want to do value stream mapping of soybean oil industry but the thing is that i am not able to calculate lead time.. how to do that? there are 3 shifts and 6 working hours a week.. and there is no certain demand statement.. can you help me in that?
‘
Thanxx
Hello Harshita – Lead time is the elapsed time it takes for work to move from process to process or from the beginning of a value stream to the end of the value stream. The number of shifts and hours worked per week can either create shorter or longer lead time due to fewer or greater resources being available for the work to be completed. Lead time is calculated from the work’s perspective. There’s no “calculation” in terms of a formula needed for determining lead time, other than adding together lead times for certain processes to determine the overall lead time for an entire value stream. The same process applies for calculating lead time of specific steps in a process when you’re mapping at the process level. I hope this helps.
Hi ms. Karen, i would like to ask some help, about value stream map our research is about vsm of a manufacturing company. And we have problem regarding this. Hope you can help us.
Hello Jochelle – What would like help with? Feel free to email me through my website.
If you have a standard setup time per operation, why or why not would it be additive to you total lead-time in a VSM?
Hi Dan – All of the elapsed time is included in Lead Time. This includes touch time, wait time, setup time, etc. I hope that helps.
HI Karen,
Great post!!
Needed your thoughts on the following hypothetical scenario:
There are 3 processes (A,B,C) through which work items flows. Cycle time for processes A,B,C are 1hr, 7hrs, 1 hr respectively. This would obvioulsy mean that the “WIP” between rpocess A and B would grow exponsentially with each day considering a “PUSH” system where A continuously processes the work item without stoppage.
Lead time , if you consider WIP time conversion, would be difficult to establish has WIP would be growing exponential. How would we calculate Lead time in such case?
As I mention in the post, there are two ways to calculate lead time. In manufacturing, it’s often the time equivalent of the WIP that exists between blocks. In office/service value streams, we typically follow one work item as it passes throughout the value stream. The lead time is the total time it takes, including both the direct work on the item (including doing, thinking, and talking about it) and any time the work item waits in queue for any reason. I hope that helps.
As I mention in the post, there are two ways to calculate lead time. In manufacturing, it’s often the time equivalent of the WIP that exists between blocks. In office/service value streams, we typically follow one work item as it passes throughout the value stream. The lead time is the total time it takes, including both the direct work on the item (including doing, thinking, and talking about it) and any time the work item waits in queue for any reason. I hope that helps. Also, I’d like to point out that WIP doesn’t need to “obviously” accumulate between steps. You can have steps with wildly different process times and if you have conmensurate number of workers for each step, you can still achieve flow. (But before adding people, we should be working hard to reduce process time, eliminate steps, and rethink the entire sequence and timing for each step.)
As I mention in the post, there are two ways to calculate lead time. In manufacturing, it’s often the time equivalent of the WIP that exists between blocks. In office/service value streams, we typically follow one work item as it passes throughout the value stream. The lead time is the total time it takes, including both the direct work on the item (including doing, thinking, and talking about it) and any time the work item waits in queue for any reason. I hope that helps. Also, I’d like to point out that WIP doesn’t need to “obviously” accumulate between steps. You can have steps with wildly different process times and if you have conmensurate number of workers for each step, you can still achieve flow. (But before adding people, we should work hard to reduce process time, eliminate steps, and rethink the entire sequence and timing for each step.)
My problem is how to calculate Takt time in built to order strategy. company make product as per customer demand. and can we directly calculate lead time without involving TAKT time??
Help plz..
You can still use takt time in BTO environment if you have any regularity at all. You may need to create different “tracks” for low, medium, and high complexity products. Lead time and takt time are different measurements. Lead time is the total time from order to delivery (or whatever “fenceposts” are relevant for your environment). Takt time is Available Work Time/Customer Demand. There’s a significant relationship between takt time and PROCESS time, in that, if you can’t meet customer demand, you need to rethink work flow, consider how you can reduce process time, and/or hire more staff once you’ve squeezed all waste out of the process. Hiring staff is clearly a last resort, not the first resort many companies take. I hope this helps.
Mam i had a question. How to calculate or understand takt time for Make-to-order environment where demand is uncertain or fluctuating ?
Thanks in advance.
It’s a big question and I’d need a lot more information to answer properly. Takt time can be and is applied in many high mix, high variation MTO environments, but there are many nuances to how it’s applied. You can have more than one takt time based on varying demand in a time period–or varying available work time. Another consideration is segmenting the work based on low, medium, and high complexity to get greater consistency and have three takt times for each segment. Before turning to takt time, I’d ask “what problem are we trying to solve?” Takt time may or may not be a helpful tool for managing the operation.
Hey Karen,
Liked the article and it lightens up while simplifying the problem of service level lead time questions. Wanted to bounce off some ideas and would like to get your thoughts on this. We’ve been using the Little’s Law to calculate lead time. But, recently we started using the following calculation: Inventory in days (Lead Time for in between processes) = WIP X Bottleneck CT. We saw that this gives us a truer picture of WIP sitting in the system. Also, sometimes depending on situation and process, we use LT = WIP X PT of next process.
We don’t use Little’s Law nor LT = WIP x PT for non-manufacturing process-level and value stream measurements due to the added layer of complexity that often exists, especially in the current state. In many cases, once a person or team picks up work from a queue or receives it from an upstream supplier and begins working on it, they aren’t able to complete it without needing to clarify, get additional information, etc. If you use the last formula you suggested, your lead time will be shorter than reality. This is why we follow the work and calculate lead time for one work item no matter what the WIP is. We note WIP as a separate measurement. I hope this helps.
Hi Karen
Can one value stream administration and manufacturing on the same map?
If admin processes are part of the value stream and within the scope of desired improvement, certainly. Enterprise-wide value streams in manufacturing can be created from New Product Development all the way through collection of revenue for the product, including purchasing, design, sales, order entry, logistics/shipping, billing, receivables — and even to service/warranty work. It all depends on what problem(s) you’re attempting to solve (what’s the driver for improvement?). Admin processes qualify as “support value streams” all on their own. For more information, please see ours and other value stream books at tkmg.wpengine.com/recommended-reading.
Hi Karen,
I am a student and have an enquiry about the VSM timeline calculation for the VSM branching process.
In your book “Value Stream Mapping”, you have said that VSM can has a minimal branching when a work proceeds through a particular process some percentage of time and bypass that process some percentage of time (P.65). I saw some authors advocate that in branch process, the timeline need to consider the weighted percentage when calculate the Process Time, Lead Time and %C&A. However, after reading your example shown in the Appendix F for both Current and Future state of VSM which have branching process, you haven’t consider the weighted percentage when calculating the timeline for PT and LT. I am getting confuse whether it is necessary to consider the weighted percentage when calculating the timeline for PT, LT and %C&A in branching process.
Second question is how to distinguish between branch process and parallel process. In the example you shown in Figure 3.12 (P.89), it’s obviously is a parallel process. When calculate the timeline, we choose the longest critical path. However, the example shown in Figure 3.2 (P.66), it seems that a concurrent parallel process rather than branch process, although it shows the weighted percentage between both process 2 and 3 & process 2 and 4 (50% respectively).
I’m look forward you can clarify such enquiry.
Thanks and Regards,
C.H. Lam
Hello C.H. – GREAT questions! I’ll answer your second question first. We use “branching” when a certain percentage of work takes one path and another percentage takes another. In these cases, the work nearly always converges again further down the value stream. We recommend labeling the push arrows (assuming push exists) with the percentage of work taking that path. In branching, all percentages should total 100%. The largest number of branches we recommend is three (we’ve allowed four in one circumstance where it didn’t clutter the map), representing three different paths the work can take. You can see an example of this in Appendix D on page 170-171 in our book (Value Stream Mapping).
Parallel processes represent work that’s done more or less concurrently for 100% of the items going through the value stream. Referring to the map in Appendix D again, blocks 10, 12, 14, and 16 run parallel to blocks 11, 13, 15, and 17. In other words, after making the repair, the tech enters his/her time card into Great Plains while, at the same time, the dispatcher completes the call in Great Plains. Two different functions are performing work at approximately the same time. The parallel paths may or may not converge. In the Appendix D example, they do not.
As for the weighted average, we typically use for TOTAL process time when calculating freed capacity. But we do not use it for lead time or %C&A. The rule of thumb from a timeline perspective is that you bring the lead time for the longest process block or series of process blocks to the summary timeline. If the lead times are significantly different for two paths, we occasionally create two summary timelines and sets of summary metrics to show the variation. But the paths would each need to handle a large percentage of the work for us to do that. In a case where only 10% of the work takes a particular path, we may include it on my map so that people can see the full picture, but we’d only include the 90% work option on the timeline (and note that the timeline represents that path — clarity is key!)
Does that help? Please let me know if I need to clarify anything. Trying to explain this via electronic means can be tricky. :-)
Best wishes for successful value stream transformation,
Karen
Hi Karen,
Thanks for your reply. Regarding to your reply, per my interpretation, if the weighted percentage between two path is significant different (as said in your reply, 90% vs 10%), we simply just show the information of the largest weighted percentage path on the timeline. If the weighted percentage of each path is large, e.g. 60% vs 40%, sometimes we need to express two timeline summary and sets of metrics to show the variation when the lead time are significant different.
In Appendix D example (P.170-171), I can understand that choosing the information of process block 6 to show on timeline because it lies on the critical path which longer lead time than process block 7 (Lead Time 1 minute). Also in (P.172-173) future state VSM, the timeline show the information of process block 7 which the path has the largest weight percentage in the branching.
As said in your reply, weighted average typically used for total process time when calculating freed capacity. For the example in Appendix F (P.182-183 & P.184-185), should the process time be calculated as in below link which the method suggested from Mark R. Hamel.
https://leanmath.com/blog/wp-content/uploads/2013/03/Lead-Time-Ladder-and-Process-Branch1.png
If you wonder to use graphical explanation, you can reply via email. Look forward to receive your reply.
Best Wishes,
C.H. Lam
Hi Karen,
Your book has helped me tremendously in creating the current state map and capture metrics. In your book you have 2 metrics PT and LT. We are focusing on bringing down LT and expecting PT also to reduce. Do you recommend this or do you think we should target PT first or both?
Thanks
Hello – I’m thrilled to hear that our VSM book is proving helpful in your improvement work. The focus of any value stream transformation is based on what problem(s) you’d like or need to solve. If you need to free capacity, PT is the focus. If you need to become more responsive, LT is the focus. PT often reduces with a LT reduction focus but not always. If you only remove waiting time, for example, that doesn’t affect PT. And there are many, many more target conditions besides reductions in PT and LT that organizations aim for, depending on business needs, type of value stream, industry, market pressures, and so on. I hope this helps.
Thanks for the response Karen. In a ticket based system, we can end up waiting for customer response which drastically affect the Lead Time. This also increases the work in progress. Any recommendations on how to improve using value stream mapping for these ticket based systems? Thank you
Hello Pranam. It’s too difficult to answer questions about specific process issues in a general way. I’d need to know a lot more to provide advice. I will say this: generally, there’s often a great deal we can do to influence customer behavior. Sometimes the long waits are because we haven’t given them what they need in the way they need it. We can also incent them to behave in a way that supports the value stream. If there’s truly nothing you can do, my question would be does it matter to them? Do they recognize how their behavior is affecting total lead time? If they don’t care, then you can improve the value stream around them. Or get new customers! I’m being serious about this last point. Many businesses trip themselves up by taking on all suitors and do themselves a great service by being selective. It’s counter-intuitive but when you’re clear on who you want to do more business with, it’s interesting how you begin to attract those customers. I hope this helps.
Hello,
is it possible to correlate capacity and lead time ? in order to estimate our ability to deliver on time and estimate our lead times at the load and capacity planning/balancing or Master production scheduling process ?
let’s imagine our customer lead time is 5 days, and our line has the right capacity (cycle time< takt time) how can we evaluate that with a certain demand/load level we will keep being under those 5 days contract ?
Has the takt time and lead time any relationship or correlation ?
Is it accurate to say to evaluate how our production lead time will be according to a certain demand to do the following: Lead time = Demand (future WIP)/constraint capacity in an MTO environment ? how could it work for MTS ?
Thanks in advance I hope I was clear in my differents questions.
Hello, Quentin. I would need to understand your situation more deeply to answer responsibly (which I can’t do on a blog post). But I can share this generally from a text book perspective: If the sum of process time (cycle time) for all processes is less than 5 days, and the takt time is less than process time @ the constraint, you should be able to meet contract requirement of less than 5 days. I hope that helps! — Karen
by Steve Ghera
Looking forward to your April 23rd Webcast. The way I help folks remember what data to put where on the square wave is this: WIP (wait time) piles UP in the queues and Work gets done DOWN in the trenches. Thought I’d share.